
| Know someone who’d enjoy The Craft of LBM Sales Newsletter? Forward this to them so they can subscribe here—and never miss a Thursday edition packed with practical sales insights. |

From Jonathan, an LBM sales leader in the Pacific Northwest:
“Bradley, this question came up today during our executive meeting: What are the top three sales rep metrics we should be tracking? Wanted to hear your take.”
Jonathan, I’ll give you my short answer, followed by some context and a pair of data visualizations.
Short answer
- Gross profit dollars
- Return on investment
- Mendoza Line
Why These Three?
1. Gross profit dollars
Two important questions:
- How much gross profit does the seller produce?
- Is it growing or shrinking?
Top line—revenue—obviously matters, but it’s like your golfing buddy who can hammer the ball 325 yards off the tee.
That’s wonderful, but it’s just the start.
If he can’t putt, that drive won’t save his score.
Gross profit dollars get us closer to understanding what the sales rep contributes to the business’s bottom line.
(Now, in an alternate universe—over a glass of Hillrock bourbon, maybe—I’d love to convince you to measure net profitability, including the hard and soft costs of serving each customer. That argument requires more than 500 words—and better data than most of us currently have.)
2. Return on Investment (ROI)
For every dollar you invest in a salesperson, how many gross profit dollars do you get in return?
Divide gross profit dollars by the total cost of employing and supporting each rep: compensation, payroll taxes, benefits, vehicle expenses, entertainment, sales training at the Sales Fundamentals Workshop, and so on.
We’ve tracked this for years with our clients. The charts below represent roughly 3,300 individual sales months.
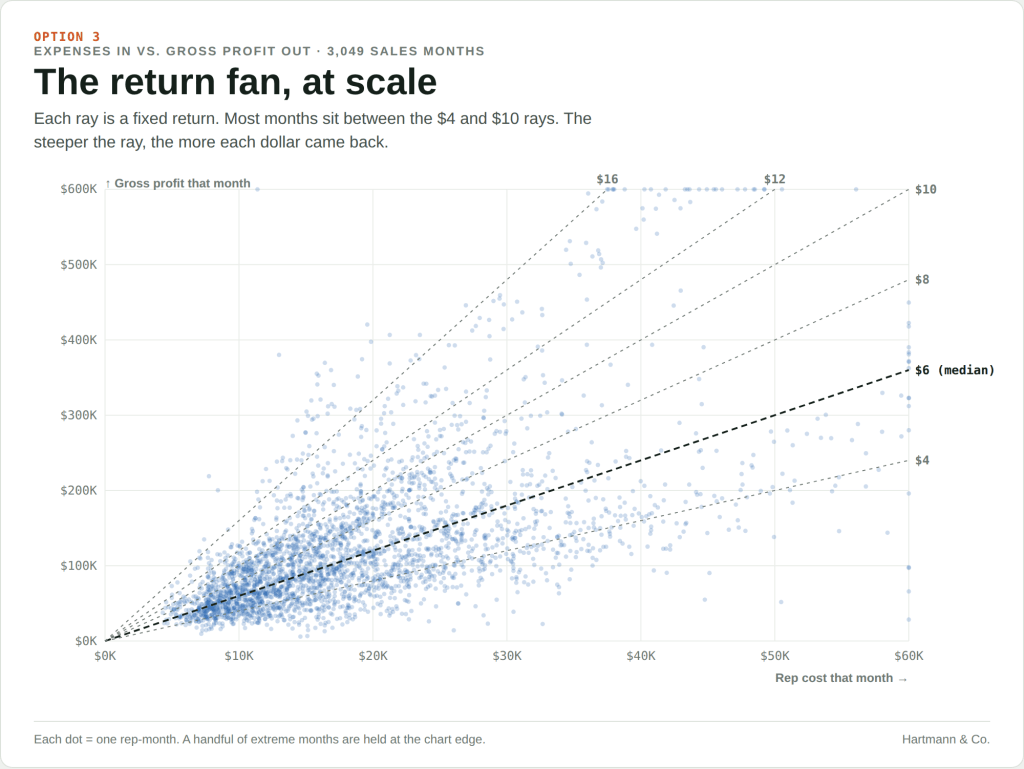
The ROI Fan Chart: Each dot represents one rep in one month. Gross profit dollars run up the vertical axis; the cost of supporting the rep runs across the bottom. The dotted lines show returns of $4, $6, or $10 in gross profit per dollar invested. Dots toward the upper left represent more gross profit at a lower cost.
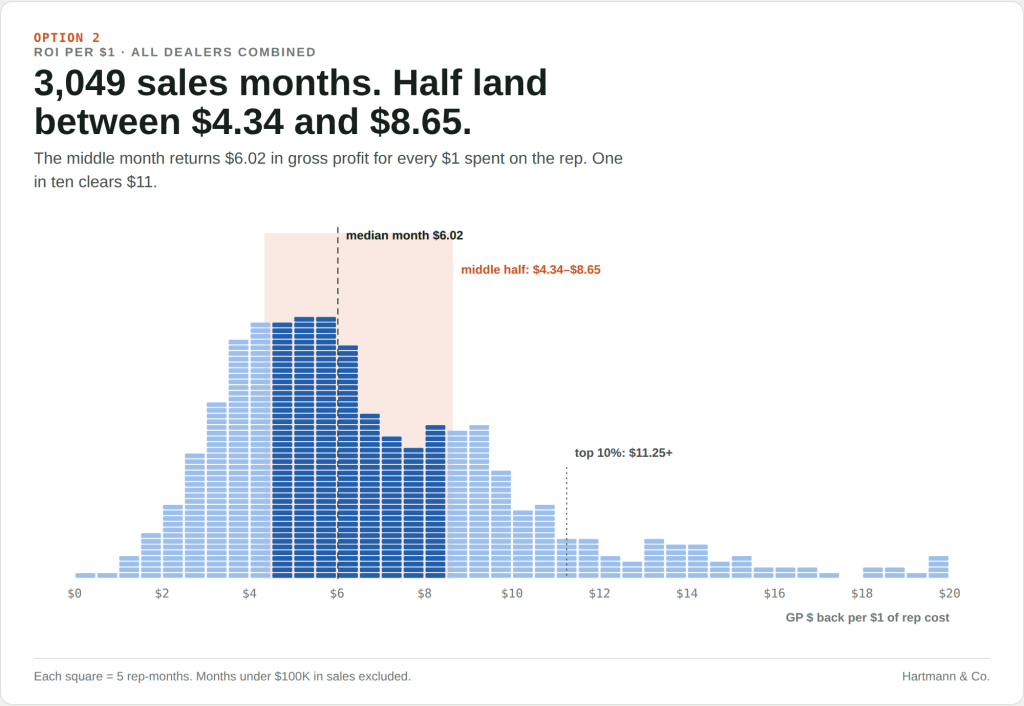
ROI Distribution: Here’s how those roughly 3,300 rep-months break down. The median return is $6.02 in gross profit per dollar invested. The middle half falls between $4.34 and $8.65. One in ten exceeds $11.
When owners and sales leaders haven’t measured ROI before, I ask what return would make them happy. The most common response is this: “Well, if I could double my money…”
Fair enough.
But what if you could get $6, $8, or $10 in gross profit for every dollar invested?
You can engineer those outcomes, and it starts with knowing your numbers. Once you do, it will help you make more informed decisions about compensation, coaching, and hiring.
ROI is essential—and yet insufficient.
Why?
Because a larger book spreads fixed costs over more business, improving the return. And plenty of LBM salespeople inherit accounts.
ROI doesn’t tell us who sold them.
3. The Mendoza Line
For every $100 in gross profit a rep generates, how much comes from net new business?
Mario Mendoza was a light-hitting shortstop who became famous for hitting .200 (just barely good enough), and it became shorthand for staying in The Show—and being sent to the minors.
The Mendoza Line in baseball is .200.
For LBM sales, I’d set the Mendoza Line at 10%: at least $10 of every $100 in gross profit should come from new customers or new product categories sold to existing customers.

Yes, managing an established book of business takes thoughtfulness, responsiveness, and skill. But we also need to know how much profitable new business a salesperson is creating.
Your challenge
Whether you’re a sales manager or a sales rep, figure out these three numbers for your team or yourself.
What do these numbers tell you about the gross profit you produce, the return on your company’s investment, and the new business you create?
If you haven’t tracked these before, gathering the data will take some work (significantly less if you’re on the GenetiQ ERP platform), but it’s worth it.
Claude.ai has made organizing and visualizing this data easier than ever.
Use it to spot patterns, ask better questions, and identify where to investigate further.
If you want help doing this, don’t hesitate to reach out.
Thanks for reading.
We’ll see you back next Thursday.
The only podcast built for LBM sales leaders and reps.
The Craft of LBM Sales Podcast delivers practical sales coaching you can use immediately—anytime, anywhere.
Subscribe here:
Apple Podcasts | Spotify
Copyright © 2026
Bradley Hartmann & Co.
All rights reserved.

Contact Bradley Hartmann:
bradley@bradleyhartmannandco.com

